Mapping Materialities with Digital Tools
I presented an early version of this map at the North American Victorian Studies Association conference in Phoenix in 2016. Although I’ve updated the details below so that they describe this iteration of the project, I’ve maintained the narrative style of the presentation to preserve its original form as an orally-delivered paper.
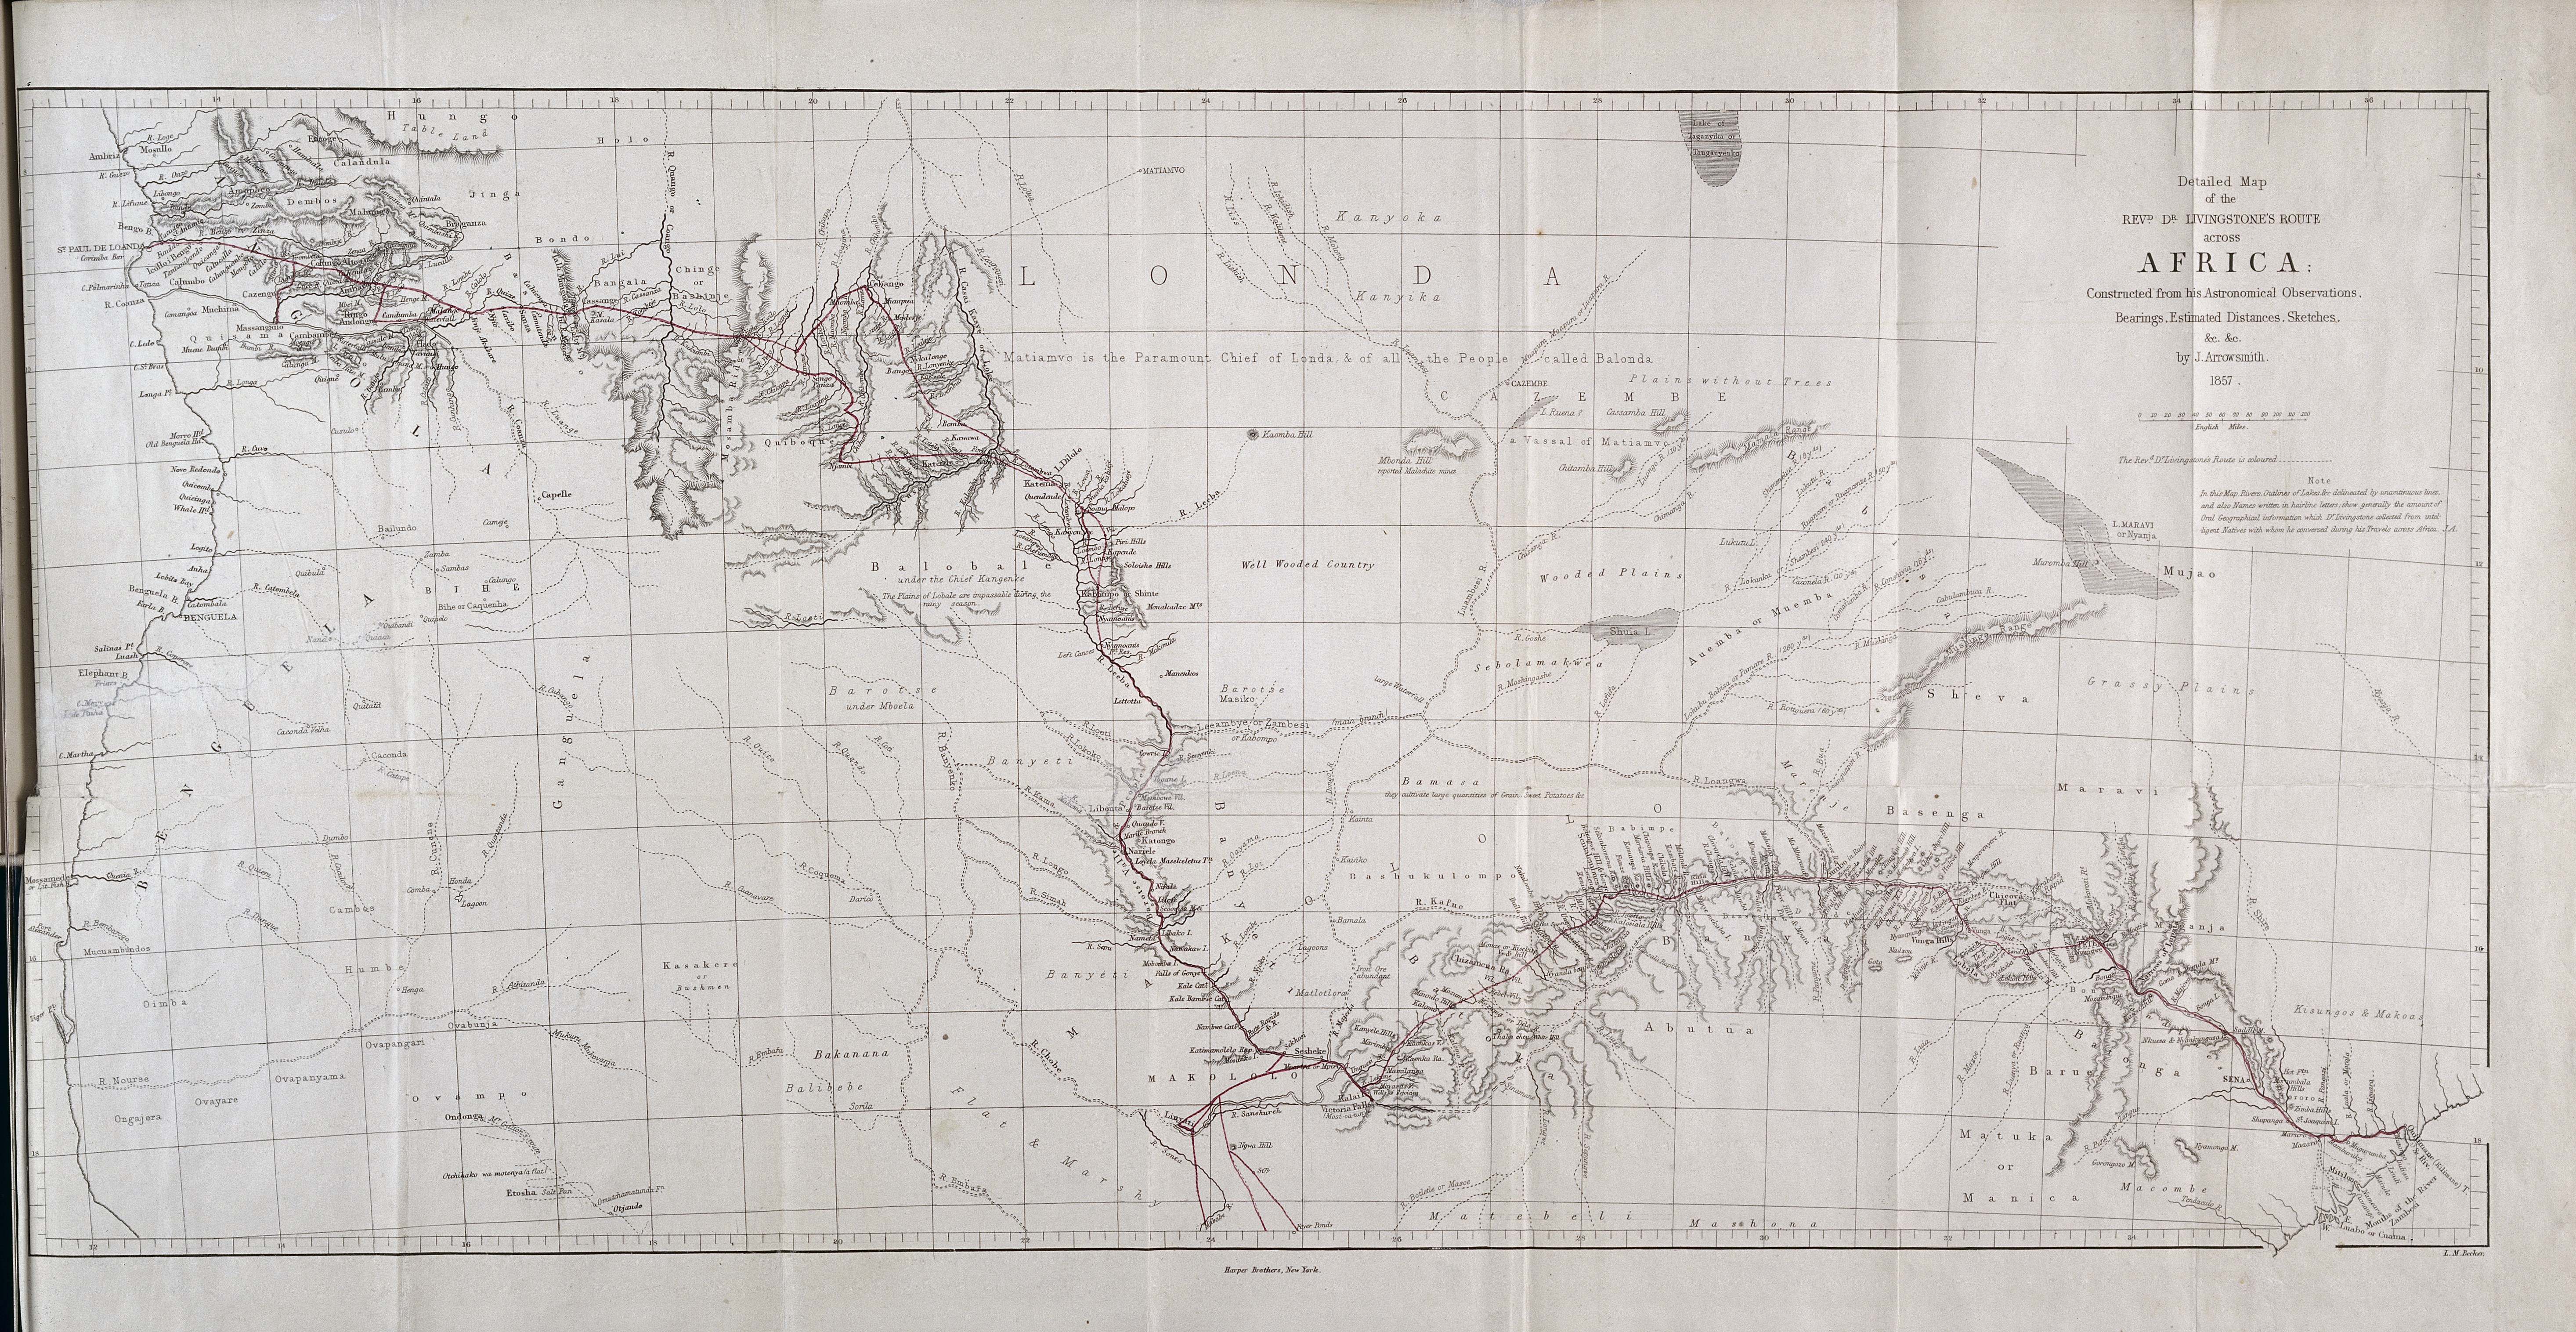
Given Livingstone’s reputation as the consummate Victorian explorer, I thought that this intellectual ground had been covered before. It was natural to assume that someone had already worked out Livingstone’s trajectory and had assigned geographic coordinates to the pivotal moments of his expedition, especially this encounter with Ishinde. But all of the maps that I found offered a macroscopic view. This meant that my attempt to locate Kabompo would be the first to locate this place within a 50 mile radius. Giddy with joy at the discovery of this lacuna, I thought that locating Ishinde on a modern map would be relatively easy. After all, Livingstone carried survey equipment with throughout his travels.
The archivists at the Royal Geographical Society informed me that Livingstone was actually a pretty terrible geographer. He had a bad habit of connecting rivers without confirming that they were part of the same body of water. By “connecting the dots,” he created rivers that apparently flowed in rectangles. What’s more, he had difficulty calculating longitude because he relied on the position of the moon rather than using a chronometer. His frequent bouts of fever made it difficult to produce an accurate reading of his sextant. So while his latitude measurements were fairly accurate, it’s often difficult to tell how far east or west he was on that line. So the coordinates that he offered in Missionary Travels were not reliable. To make matters even more challenging, digital mapping tools require a degree of specificity that Livingstone considered impossible to measure while in Central Africa.
My first attempt to locate Ishinde used print technology as my base. Theresa Quill, IU’s mapping librarian, suggested taking a scan of the Missionary Travels map and molding it to a modern map of southern Africa using the map-warping tool built by the New York Public Library. The process involves pinning known parts of a historical map to a modern one. The software then skews the image of the historical map in order to accommodate the pins. Map warpers work especially well for urban areas and for European spaces thanks to extensive efforts in the nineteenth-century to create accurate surveys of these spaces. Since Livingstone took his measurements once, they lacked the accuracy of maps of European terrain. The inaccuracies in Livingstone’s map were compounded by the fact that publically available maps of this region contain little information about key landmarks. Without the names of rivers, hills, or small towns, I was unable to identify few landmarks close to the Angola/Zambia border. This ultimately reduced the map warper’s accuracy. What’s more, the software treats a three-dimensional surface as a two-dimensional plane, so the warped image did not take the region’s topography into account. Villages ended up in the middle of lakes, rivers in the middle of trees—utter chaos.
The solution to this dilemma required a combination of Victorian technology, nineteenth-century print material, and modern visual navigation tools. The archivists at the Royal Geographical Society directed me Tactical Navigation Charts or TNCs—which are designed to help pilots navigate by sight. These maps show flood plains and vegetation, making them particularly useful for reading the African terrain. Yet, the typeface on the Missionary Travels map and the TNCs were almost impossible to read due to their miniscule scale. The best magnifier for these sorts of documents is actually the condenser from an improved phantasmagoria lantern which was originally designed to magnify the light from an oil lamp. In other words, I resorted to reading maps through the lens of the lantern in the most literal sense.
Thus armed with the condenser from a Victorian projector, I was able to identify topographical features like the Soloishe Hills, helping me to see the similarities between these two documents. The orientation of the hills is puzzling from a bird’s eye view, but when treated as visualization of an embodied experience of a landscape, the Missionary Travels map suggests that Livingstone traveled over parts of these hills on his way to Shinte’s, resulting in the horse-shoe shape that you see here. What also became more visible were Livingstone’s errors. By spotting the differences between these two maps, I was able to rule out the places that he most likely did not see. Around Lake Dilolo, for example, you’ll notice that Livingstone draws connections between rivers that should not be there. The TNC’s legion then enabled me to assign geographic coordinates—12 degrees, 32 minutes, 30 seconds South: 22 degrees, 57 minutes East.
While it is impossible to know exactly which route Livingstone took, comparing topographical features generates coordinates within a ten-mile margin of error, offering an unprecedented degree of geographical specificity. But my delight stems not from this maps precision but how it reshaped my understanding of Livingstone’s writing practices and his African context. To be sure, mapping magic lantern shows specifically and travel narratives more broadly puts me in a similar position to the Victorian arm chair geographers who spent their days correlating maps without ever having seen these spaces. Representing Livingstone’s expedition through a new digital visualization is not an effort to perpetuate the tendency to heroize a Victorian explorer. Rather, it is an attempt to restore African perspectives to visualizations of this region’s history.
This process drew my attention to the incredibly complex political landscape through which Livingstone traveled and the ways in which the physical terrain shaped emergent trade networks. The geographic and temporal distribution of Livingstone’s lantern shows suggests that this physical and social millieu not only affected the tone of his lantern shows, but also contributed to when and where Livingstone wrote about his context. In the Livingstone chapter, you’ll see the maps overlaid with prose describing how the Kololo expedition navigated the increasingly tricky political terrain as they traveled toward the coast. In this mapping endeavor, my mapping ambitions exceeded my technical expertise. Ideally, the map with the modern country labels would be replaced by a satellite image that labeled natural features. Due to an inscrutable setting buried deep in the base map’s nesting layers, I could not find a way to make the labels describing land formations and waterways appear large enough to be read on a pan-African scale. (They appeared rather mysteriously only when the user was zoomed into to a 30 mile radius of a particular point.) Should this project move to another platform, I would strongly consider using an open-source GIS tool like Mapbox to create more sustainable maps, provided that I had sufficient javascript support.